Monday starts with three different revenue numbers for the same week. Sales pulled one from the CRM, finance used the ERP, and operations built its own spreadsheet to explain shipment delays. Leadership does not have a reporting problem at that point. It has a systems problem.
Software for a management information system helps only when it resolves that disconnect at the source. In real implementations, the value comes from standard definitions, reliable data flows, and reporting logic that holds up under scrutiny. If those pieces are weak, the platform becomes an expensive wrapper around inconsistent data.
That distinction is critical because buyers are rarely choosing between "has dashboards" and "doesn't have dashboards." They are choosing between systems that are cheap to demo and systems that are realistic to run. The gap shows up in integration work, data cleanup, user permissions, training time, and the ongoing cost of keeping reports accurate as the business changes.
I have seen teams approve MIS software based on polished reporting screens, then spend the next six months arguing over product codes, customer hierarchies, and who owns master data. The software was not the whole problem. The buying process ignored total cost of ownership.
A useful MIS improves reporting speed and management visibility. A useful MIS also fits the skill level of the team expected to maintain it. Some platforms give analysts a lot of control, but require stronger data modeling discipline. Others are easier to operate day to day, but become restrictive once the business needs custom workflows, multi-entity reporting, or deeper integrations.
That trade-off deserves attention early. Feature lists rarely show the operational load that comes after go-live.
From Data Overload to Decisive Action
An MIS becomes necessary when leaders stop trusting the numbers in front of them. That usually happens after a few predictable failures. Sales reports don’t match finance. Inventory looks healthy until customer orders expose stock gaps. Executives ask for a simple trend view and analysts spend hours reconciling fields from three systems.
Software for management information system is supposed to fix that gap between raw activity and usable decisions. The strongest platforms centralize data flows, standardize definitions, and deliver reporting that reflects business reality instead of departmental interpretation. That sounds straightforward. It rarely is.
What decision-makers are actually buying
Most buyers think they’re buying dashboards. They’re really buying four things at once:
- Data consistency: Common definitions for customers, products, orders, and locations.
- Process visibility: A way to trace what happened, where, and why.
- Decision support: Reports and alerts that help managers act before small issues become operational problems.
- Control: Governance over who can see, edit, approve, and distribute information.
If one of those pieces is weak, the whole system feels unreliable.
Practical rule: If your team still resolves metric disputes in meetings, you don’t have an MIS advantage yet. You have a presentation layer problem sitting on top of a data problem.
Where many projects go wrong
The biggest mistake I see is treating MIS as a software purchase instead of an operating model change. Teams focus on feature demos, then discover later that their customer records are duplicated, their workflows aren’t standardized, and managers want different KPI definitions by business unit.
That’s why total cost of ownership matters more than the front-page feature list. License pricing is visible. The actual expense shows up in integration work, data cleanup, permissions design, user training, and support after go-live. A practical evaluation has to include all of that, or the shortlist will be wrong from day one.
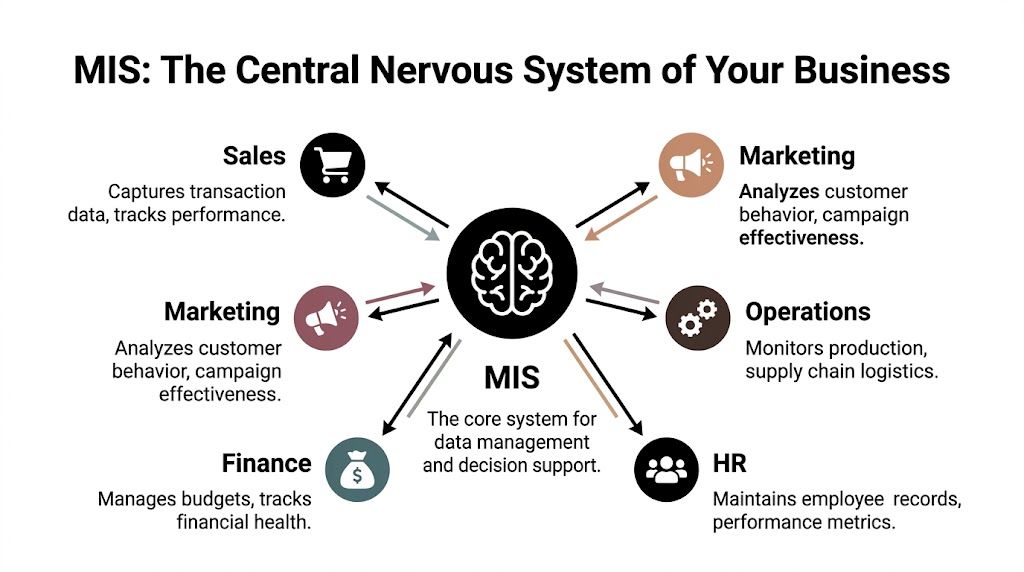
What Is an MIS A Central Nervous System for Your Business
Monday morning usually exposes the gap. Sales says demand is up, operations says fulfillment is slipping, finance questions the margin number, and every team has a different spreadsheet to prove its case. An MIS is the layer that turns those competing snapshots into a management view leaders can run the business on.
At its best, an MIS functions as the central nervous system of the business. It gathers inputs from across departments, applies shared logic, and routes usable information to the people responsible for decisions. If those inputs arrive late, carry conflicting definitions, or miss key context, managers react to noise instead of conditions on the ground.
Spreadsheets can summarize data. Departmental systems can store transactions. Neither one reliably gives leadership a coordinated picture of performance, risk, and exceptions across the whole operation.
What it does in plain terms
A useful MIS pulls data from sales, finance, operations, marketing, and HR, then reshapes it into reports, alerts, trends, and exception views that managers can review quickly. The point is not to show every transaction. The point is to show what changed, where performance is drifting, and which issue needs attention first.
A vehicle dashboard is a better model than a box of raw parts. Managers need signals they can act on, not a dump of invoices, orders, shipment records, attendance logs, and campaign responses. Good MIS software converts those low-level events into summaries with context.
That conversion sounds simple. In practice, it takes data mapping, business rules, role-based access, and ongoing maintenance. That is why the cost of an MIS extends well beyond the license.
Why spreadsheets stop being enough
Spreadsheets hold up for a while. Then the business adds product lines, locations, approval layers, or tighter reporting requirements, and the spreadsheet model starts to crack.
The usual failure points are familiar:
- Multiple teams maintain separate files: version conflicts and manual reconciliation become routine.
- Definitions drift over time: revenue, margin, active customer, and stock on hand no longer match across departments.
- Analysts spend hours assembling reports: the team burns time combining exports instead of interpreting results.
- Sensitive data moves through email: access control becomes inconsistent and audit trails disappear.
An MIS addresses those gaps by standardizing rules and connecting source systems. In many environments, it also becomes the reporting layer that supports business process automation software, especially where approvals, escalations, and recurring operational decisions depend on the same shared data.
No system creates perfect truth. But a well-run MIS gets a company much closer to one agreed version of the numbers, which is usually what management needs.
Managers do not need every transaction on screen. They need dependable signals, clear exceptions, and enough traceability to trust the number before they act on it.
What managers should expect from it
A capable MIS should reduce the number of basic performance questions that require ad hoc analyst work. If managers still wait days for routine answers, the system may exist on paper but not in operational terms.
| Management question | What the MIS should provide |
|---|---|
| Are we on target this week or month? | Standard reports and current KPI views |
| Where are operations slipping? | Exception reporting and drill-down visibility |
| Which business unit needs attention? | Comparative performance views across teams or locations |
| Can we trust this number? | Traceable data lineage and shared definitions |
The trade-off is straightforward. A simpler MIS is cheaper to buy and faster to launch, but it usually leaves more manual work with analysts and department managers. A more capable MIS can improve control and decision speed, but it demands better data discipline, clearer ownership, and people who can maintain the reporting logic after go-live.
That is the part buyers often underestimate. MIS software is not just a reporting tool. It is a management system that only works if the business is willing to define its rules, maintain them, and use them consistently.
Core Features and Modules of MIS Software
Teams usually discover the shape of MIS software a few weeks after go-live. The demo looked clean. Then finance asks for a month-end pack with one-off adjustments, operations wants a same-day exception view, and someone notices customer names do not match across source systems. That is when feature lists stop mattering and operating characteristics start to matter.
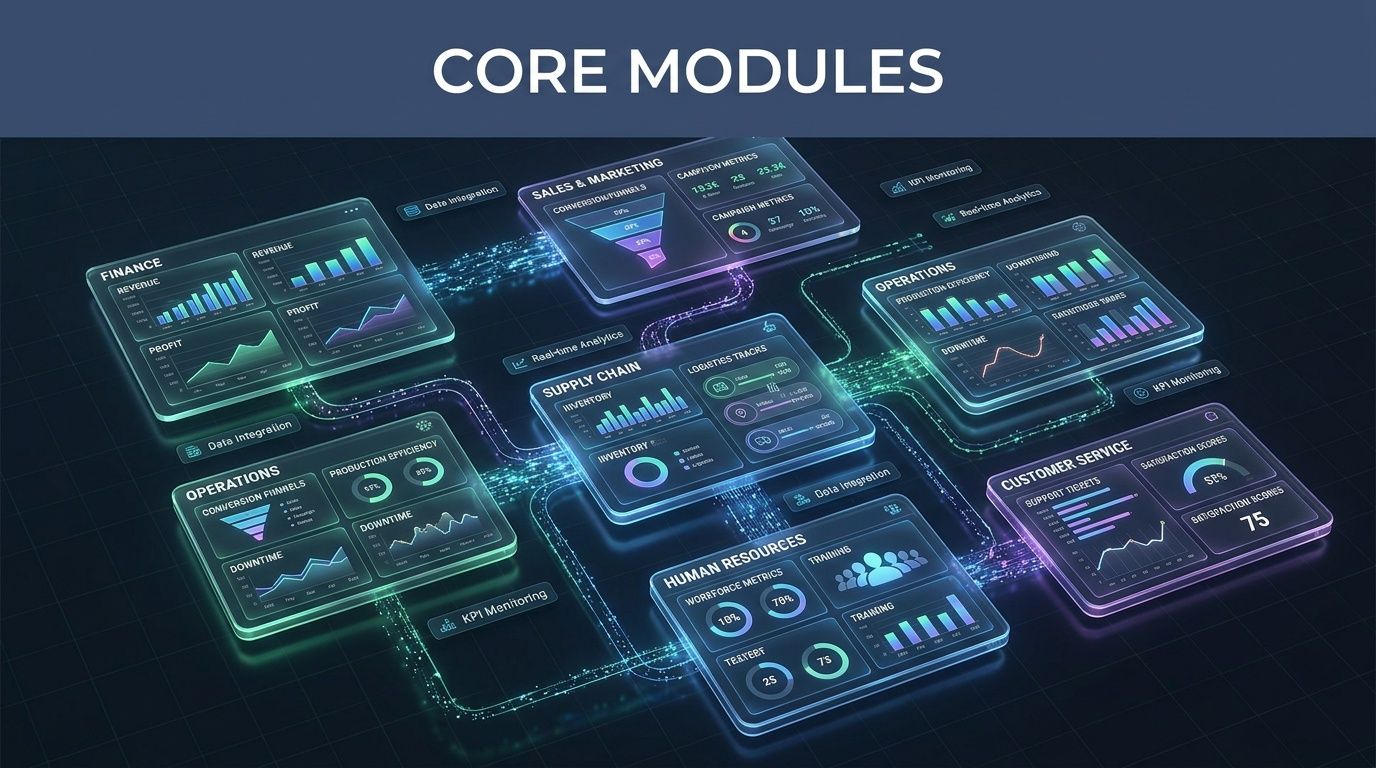
The useful way to assess MIS modules is to ask three questions. What management decision does this module support? How much administration will it require after launch? Which skills must stay in-house so the business is not dependent on the vendor for routine changes? Those answers have more impact on total cost of ownership than another checkbox in a comparison grid.
Reporting
Reporting carries most of the day-to-day load in an MIS. Management needs recurring financial summaries, operational performance reports, inventory status, service levels, and audit-ready extracts. A good reporting module handles scheduling, controlled distribution, version consistency, and role-based access without turning every format change into analyst rework.
The trade-off is flexibility versus maintainability. Highly configurable report designers can satisfy edge cases, but they often create fragile templates that break after upstream schema changes or staff turnover. Simpler reporting tools are easier to support, but they may push complex analysis back into spreadsheets. I have seen both outcomes. The cheaper option at purchase can become the expensive option six months later if monthly reporting still depends on one power user.
How We Test This
We test reporting with business scenarios, not canned vendor data.
- Recurring outputs: We build scheduled reports for finance, operations, and management, then check whether formatting and delivery remain stable over multiple refresh cycles.
- Exception handling: We introduce missing values, changed field names, and late-arriving records to see whether failures are visible and recoverable.
- Distribution controls: We verify whether access follows role rules without manual file sharing.
- Revision effort: We measure how long a competent internal user needs to update a live report after a change request.
Dashboards and visualization
Dashboards help when they shorten the path from question to action. They fail when every department gets its own interpretation of revenue, margin, backlog, or service performance. The visual layer is usually the easiest part to buy and the hardest part to govern.
Popular tools such as Microsoft Power BI can work well in an MIS stack because many analysts already know the interface and there is a large hiring pool. That reduces training cost. It does not remove the need for model governance, semantic consistency, or someone who owns KPI definitions. If those controls are weak, dashboard adoption rises while trust falls. That is a bad trade.
We score dashboard modules on whether managers can answer routine questions quickly without creating new ambiguity. If your team also needs workflow and approval logic around operational reporting, this guide to business process automation software is a useful companion read.
How We Test This
Visual polish gets very little weight in our testing.
- Build speed: We ask both an analyst and a manager to create role-specific views, then compare effort and output quality.
- Refresh behavior: We confirm that source changes appear reliably and on schedule.
- Drill-down logic: We test whether users can move from summary to detail without losing context.
- User comprehension: We remove vendor guidance and see whether a new user can answer practical business questions unaided.
A short product demo helps show the category in motion:
ETL and data preparation
ETL and data preparation usually determine whether the MIS becomes trusted infrastructure or another reporting layer people work around. Source systems rarely line up neatly. Customer IDs differ. Product names are inconsistent. Timestamps use different rules. One department closes the month on a different calendar than another.
Vendors often treat this module as plumbing. In practice, it drives a large share of implementation effort and ongoing support cost. A polished dashboard sitting on weak transformation logic still produces weak management information. The problem just shows up later, after users have already started making decisions from it.
This is also where team capability matters. If every transformation rule requires specialist consulting hours, the apparent software price understates real ownership cost. Internal teams need enough access and clarity to trace business rules, change mappings, and recover from failed jobs without opening a paid support ticket for every issue.
How We Test This
Our ETL testing is intentionally messy.
- Source diversity: We connect structured exports, operational data with inconsistent naming, and files with partial fields.
- Data hygiene stress: We introduce duplicates, blanks, and invalid values.
- Transformation traceability: We verify whether business rules are visible, documented, and editable by trained internal staff.
- Recovery behavior: We simulate pipeline failures and inspect alerting, rollback options, and retry logic.
Analytics and forecasting
Analytics and forecasting can add value, but only after baseline reporting is stable. Many MIS buyers pay for advanced forecasting before they have agreed definitions for bookings, churn, utilization, or stock coverage. The software then gets blamed for bad forecasts that were never going to be reliable.
The practical question is not whether a tool includes predictive features. The question is whether your data history, planning cadence, and user skill level justify them. Advanced models increase software cost, setup effort, and dependence on specialist users. For some organizations, trend analysis and scenario planning produce better returns than a more ambitious forecasting module.
How We Test This
We use historical operational data where possible and ask a simple question. Does the output change a real decision?
- Trend usefulness: Can managers identify a concrete action, not just an interesting pattern?
- Scenario flexibility: Can planners adjust assumptions without breaking the model?
- Explainability: Can a business user understand how the result was produced?
- Operational fit: Does analysis sit inside the management workflow, or does every request require specialist intervention?
Access controls and governance
Governance rarely wins the demo, but it often decides whether the MIS stays credible. Access controls, approval rules, audit logs, report certification, and content lifecycle management keep self-service reporting from turning into unmanaged report sprawl.
There is a real trade-off here too. Tight governance improves consistency and auditability, but it can slow down business users who want quick changes. Loose governance speeds up local reporting and almost always creates duplicate KPIs, conflicting versions, and arguments over whose number is correct. The right balance depends on your regulatory exposure, reporting cadence, and tolerance for local variation.
How We Test This
We test governance by trying to break administrative control.
- Role separation: We assign different business roles and confirm that visibility changes correctly.
- Approval flow: We test whether sensitive changes require review before publication.
- Audit trace: We inspect whether edits, refreshes, and distribution events can be traced later.
- Sprawl resistance: We create derivative reports and dashboards, then assess how well admins can control duplication and certify the approved version.
Understanding Deployment Architecture and Data Integration
Architecture choices shape the long-term usefulness of an MIS more than most buyers expect. A system can look ideal in a proof of concept and still become expensive or restrictive later if the deployment model doesn’t match your operating environment.
Cloud deployments usually win on speed and administrative simplicity. On-premise deployments still matter when data control, latency concerns, internal hosting preferences, or strict security requirements dominate. Hybrid models often sound like the compromise. They can be, but they also add coordination overhead because teams now manage integration and governance across two worlds instead of one.

Choosing the right deployment model
There isn’t a universal best option. There is only a best fit for your constraints.
| Deployment model | Usually works well for | Common trade-off |
|---|---|---|
| Cloud | Teams that want faster rollout and less infrastructure ownership | Less direct control over some technical layers |
| On-premise | Organizations with strict internal control requirements | More maintenance burden and slower upgrades |
| Hybrid | Businesses connecting legacy systems with newer cloud services | Higher integration and governance complexity |
The mistake is choosing architecture based on abstract preference. Pick based on your systems environment, internal support model, and compliance reality.
Integration is where the value shows up
MIS software only becomes credible when it reconciles data across the systems your business already depends on. That can include ERP, CRM, warehouse, e-commerce, finance, payroll, and planning tools. If those links are weak, management reporting remains partial.
This is why master data management, or MDM, matters. Enterprise MDM solutions such as IBM InfoSphere Master Data Management create a unified view of business entities by matching, validating, and harmonizing information. User benchmarks from G2 cited in this IBM InfoSphere MDM overview show it can reduce data redundancies by up to 30-50% in large organizations.
That’s a meaningful outcome when duplicate customer, supplier, or product records are distorting reports and process flows.
The fastest way to lose trust in an MIS is to let two systems define the same customer differently.
What enterprise-grade integration really requires
IBM InfoSphere MDM is a good example of where trade-offs become obvious. It’s configurable, multi-domain, and built for organizations that need a unified view across disparate systems. It also carries real implementation weight. In hands-on enterprise environments, tools at this level usually demand stronger governance, clearer ownership, and more specialized technical skills than midmarket products.
That doesn’t make them wrong. It means buyers should match complexity to need. If your environment includes broad multi-system integration, products, suppliers, customers, and locations all needing consistent master records, heavier MDM can be justified. If your goal is straightforward departmental reporting, it’s often too much system for the problem.
For teams comparing integration-heavy software stacks, this review of supply chain integration solutions gives useful context around connectivity demands and downstream operational impact.
How to Evaluate and Select the Right MIS Software
The best MIS product on paper can still be the wrong buy. Selection should be less like feature shopping and more like risk reduction. When buyers skip structured evaluation, they usually overvalue demos and undervalue fit.
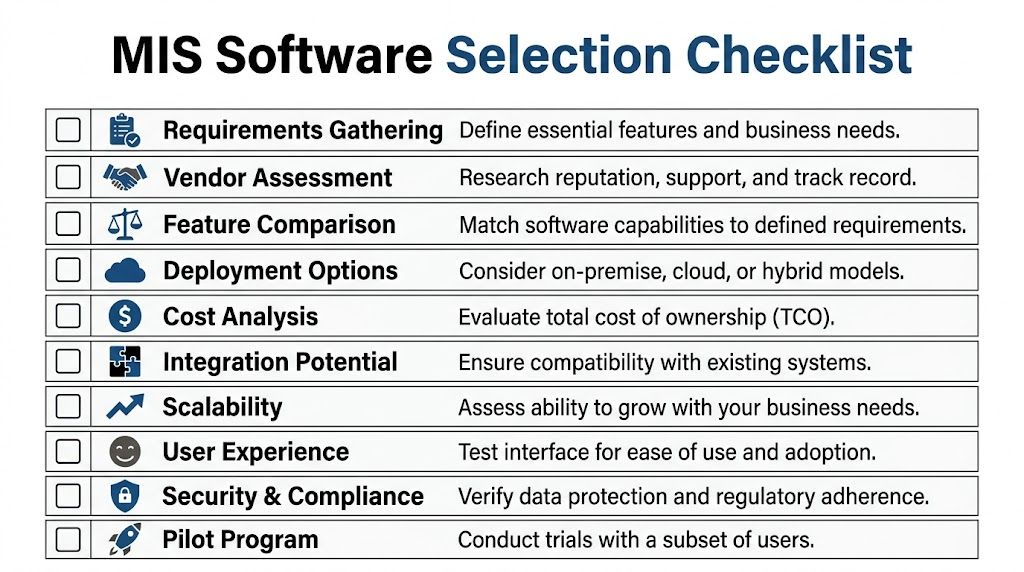
Four pillars that matter more than vendor polish
Start with business requirements, but don’t stop there. Good procurement balances organizational needs with technical reality and post-purchase effort.
Business requirements
List the decisions the MIS must support, not just the reports it should display. If leadership needs profitability by channel, service level by region, and inventory visibility by location, write those use cases in plain language. The system should be tested against those outcomes.
Technical fit
Check integration options, data model flexibility, access controls, scalability, and the internal skills required to maintain the platform. A technically impressive product that your team can’t support will age badly.
Vendor assessment
Support quality, implementation ecosystem, product roadmap clarity, and responsiveness matter. You don’t need marketing confidence. You need evidence that the vendor can help your team get through edge cases without prolonged disruption.
Total cost of ownership
License cost is only the visible layer. Configuration effort, migration work, training load, consulting support, change requests, and ongoing admin time often shape the actual spend more than the initial quote.
Selection advice: If the vendor avoids giving direct answers about implementation workload, assume the project will be harder than the demo suggests.
How we run practical product evaluations
Strong evaluations use real workflows and real data. That means a pilot or controlled trial, not a scripted showcase. We typically test around core management questions, exception handling, and day-to-day usability for both technical and non-technical users.
A defensible buying process includes:
- Live scenario testing: Use your own exports, naming conventions, and reporting requirements.
- Workflow timing: Measure how long common tasks take, such as adjusting a report, tracing a KPI, or changing user access.
- Edge-case review: Test duplicate records, failed imports, conflicting hierarchies, and unusual approval paths.
- User mix: Include analysts, managers, and admins. They experience the same product very differently.
A simple scoring model
Use weighting to force hard choices. Not every criterion deserves equal influence.
| Criteria | What to Look For | Weighting (Example) |
|---|---|---|
| Business fit | Supports priority management decisions and required reporting outputs | High |
| Integration | Connects cleanly to existing systems and handles data exceptions | High |
| Usability | Managers and analysts can work without heavy friction | High |
| Governance | Permissions, auditability, and report control are strong | Medium |
| Scalability | Can support growth in users, entities, and data complexity | Medium |
| Vendor support | Responsive help, implementation guidance, clear roadmap | Medium |
| Cost structure | Transparent pricing and manageable ongoing admin effort | High |
Don’t let a product win because it performs well in one department’s preferred use case while introducing risk everywhere else.
Pilot before commitment
A real pilot surfaces hidden friction early. It shows whether your data is ready, whether managers trust the outputs, and whether admins can run the system after consultants leave. It also gives procurement a clearer basis for comparing vendors that look similar in slide decks.
If your shortlist includes integration platform vendors or products with broad connector ecosystems, this analysis of Dell Boomi competitors can help sharpen the technical evaluation side of the buying process.
Navigating Implementation Complexity and Total Cost
Monday morning after go-live, the CFO opens a margin report that does not match finance, operations sees inventory in the wrong locations, and managers stop trusting the dashboard before the project team finishes its first status call. That is how MIS projects lose value. The software may be working exactly as configured, but the implementation has not translated business rules, ownership, and data quality into something people can rely on.

Where implementation effort really goes
The visible plan usually looks straightforward: discovery, configuration, migration, testing, training, and go-live support. Real projects are less tidy. As soon as managers see their own live data in the system, they start spotting exceptions, arguing over definitions, and requesting changes that were never raised in vendor demos.
That is normal.
Effort tends to collect in four areas that look minor during procurement and consume serious time later:
- Data cleanup: Legacy records often contain duplicate suppliers, inconsistent product codes, retired cost centers, and missing field ownership.
- Security and permissions: Access design affects compliance, manager trust, and internal politics. It takes more workshops than buyers expect.
- Report rationalization: Different teams ask for versions of the same KPI with different formulas, dates, or exclusions.
- User adoption: Training fails when it only explains clicks. People need to understand what decisions the system supports and which numbers are now official.
Integration work also shifts the budget faster than license fees do. Connecting ERP, CRM, finance, spreadsheets, and departmental databases is not just a technical exercise. Teams have to decide which system owns each field, how often data refreshes, what happens when records fail validation, and who fixes those failures. Those choices shape reporting accuracy and support workload for years.
Pricing is only one layer of cost
License pricing matters, but it rarely explains the full spend. A lower-cost subscription can turn into a high-maintenance environment if it needs custom connectors, outside consultants, or constant analyst intervention to keep reports aligned.
I usually break MIS total cost into five buckets: software fees, implementation services, internal labor, integration and data remediation, and ongoing administration. The first bucket is the easiest to approve. The other four decide whether the platform remains useful after year one.
Vendor packaging also hides trade-offs. Some products look inexpensive because reporting is included, but advanced permissions, workflow, sandbox environments, or API capacity sit in higher tiers. Other products carry a heavier upfront price and lower ongoing rework because the data model, controls, and standard integrations are more mature. There is no universal winner here. The right answer depends on how standardized your processes already are and how much technical skill you can support in-house.
Budget for capability, not just software
An MIS project needs named owners inside the business. Someone has to define master data standards. Someone has to approve KPI formulas. Someone has to test edge cases before managers see them in production. Someone has to support users after the implementation partner leaves.
If those roles stay informal, costs rise fast. Issues surface late, consultants spend time resolving avoidable disputes, and internal teams start building spreadsheet workarounds that undercut the system you just paid for.
MIS projects become expensive when the organization buys software before assigning process ownership.
A realistic budget includes training time, testing cycles, cleanup work, report refinement after launch, and support coverage for the first few reporting periods. It should also reflect the cost of choosing a highly flexible platform. Flexibility sounds attractive during selection. In practice, it demands stronger governance, better documentation, and people who can maintain configuration choices over time.
The cheapest MIS option on paper often becomes the most expensive one to operate.
MIS in Action Real-World Examples and Case Studies
A plant manager sees one inventory number in the ERP, a different number in the warehouse system, and a third on a supervisor’s spreadsheet. By the time finance closes the month, the argument is no longer about reporting. It is about which number the business will trust. That is the point where MIS software either proves its value or exposes weak process control.
The strongest case studies are rarely about flashy dashboards. They are about reducing rework, shortening decision cycles, and making managers less dependent on manual reconciliation. They also show the trade-off many buyers miss. A system that looks affordable in a demo can become expensive if it needs heavy cleanup, custom integration, or constant analyst support after go-live.
Midmarket manufacturing with SAP Business One
For a growing manufacturer, the first win usually comes from getting sales, inventory, purchasing, and finance onto the same operating rhythm. SAP Business One is often a reasonable fit here because it brings transactional discipline and manager reporting into one environment without the overhead of a larger enterprise stack.
In practice, successful deployments stay narrow at the start. Item masters get cleaned up. Order status and inventory movements get standardized. Finance and operations agree on the same definitions for margin, backlog, and fulfillment status. Teams that skip that groundwork usually end up with a polished reporting layer sitting on top of avoidable data disputes.
I have seen this pattern more than once. The software itself was not the hard part. The hard part was agreeing on whether one product sold in two packaging formats should be managed as one item or two, and then making every downstream report follow that rule.
That distinction affects purchasing, production planning, customer service, and profitability reporting. It also affects cost. If the business does not settle those rules early, consultants spend more time rewriting logic, users keep exporting data to spreadsheets, and support effort stays high long after launch.
Larger enterprise with multi-domain data demands
A larger retail, wholesale, or distribution business faces a different problem. The issue is less about one department seeing current numbers and more about multiple business domains using the same definitions across products, suppliers, customers, channels, and locations.
That often justifies a broader MIS design with stronger master data controls, a formal data model, and staged integration work. The benefit is consistency at scale. The cost is higher implementation effort, more specialized skills, and a longer path to stable reporting. Many firms underestimate that second part.
What works in these environments is governance-first execution. Each domain needs an owner. KPI definitions need sign-off before reports are built. Integration errors need triage rules, not informal fixes by whoever notices them first. When that structure is in place, leadership gets rollups they can use. When it is not, teams get conflicting reports with professional-looking charts.
The lesson from both cases is simple. MIS success comes less from the product category and more from the fit between system design, process maturity, and internal team capability. The best results usually come from solving a narrow set of high-value decisions first, then expanding once the data rules and operating habits hold up under real use.
Common Pitfalls and Ensuring Long-Term ROI
Three months after go-live, the dashboard opens on every manager’s screen, but critical tasks are still performed in exported spreadsheets. I see that pattern more than outright system failure. The software is live, the licenses are paid for, and the expected return never shows up in day-to-day decisions.
A common reason is feature overbuying. InformationWeek’s review of cloud adoption surveys found that many companies leave a large share of advanced cloud capabilities unused, which lines up with what implementation teams see in practice across MIS programs. Buyers pay for forecasting, workflow, AI-assisted analysis, or broad self-service reporting, then discover those tools need cleaner data, tighter governance, and more analyst support than the business can sustain.
The most common failure patterns
These problems show up repeatedly after launch.
- Poor source data: An MIS will expose bad upstream data faster than it fixes it. If customer, inventory, finance, or operations records conflict at the source, reporting errors spread wider and become harder to explain.
- Weak adoption: Managers go back to spreadsheets when load times lag, definitions change without notice, or one report conflicts with another.
- Overbuilt scope: Teams buy advanced modules that look impressive in demos but never make it into real operating routines.
- No ownership after launch: Once the project team steps away, report sprawl, duplicate KPIs, and low-value enhancement requests start to pile up.
What actually protects ROI
Long-term return comes from operating discipline and realistic scope control.
Keep the first rollout narrow
Start with a small set of decisions that matter financially or operationally. That usually means margin visibility, inventory exceptions, order performance, cash reporting, or service-level issues. A narrower rollout reduces training overhead, lowers rework, and makes it easier to prove whether the system changed behavior.
Treat governance as a live function
Permissions, metric definitions, master data rules, and report approval need an owner after go-live. In smaller firms, that may be one business systems lead with department backing. In larger firms, it usually needs a cross-functional governance model and regular review.
Review usage, not just uptime
A system can be available 99.9% of the time and still miss the business case.
Track which dashboards get opened, which reports trigger follow-up action, which teams still export data, and which licensed features sit idle. That is where hidden TCO shows up. Unused modules still create admin overhead, support demands, vendor costs, and training debt.
A stable MIS that nobody relies on is still a failed investment.
Refresh the system as the business changes
New product lines, acquisitions, channel shifts, pricing changes, and reorganizations all affect reporting logic. If the MIS stays frozen while the business changes, trust drops gradually at first, then all at once when leaders start getting different answers from different teams.
The companies that get lasting value treat MIS as managed business infrastructure. They budget for data stewardship, report maintenance, user training, and periodic redesign. They also challenge feature requests hard. If a capability does not improve a real decision, reduce manual effort, or tighten control, it usually does not belong in the next phase.
For teams comparing options, the right question is not which platform has the longest feature list. It is which system your team can support, govern, and use well over the next three to five years at a cost the business will still accept once implementation is over.